









Monitoring with Prometheus & Grafana
The cloudflared agent that DockFlare manages can expose a wide range of performance and health metrics in the Prometheus format. By collecting and visualizing these metrics, you can gain valuable insights into your tunnel's traffic, latency, and error rates.
This guide explains how to enable the metrics endpoint and provides a quick setup for a monitoring stack using Prometheus and Grafana.
Step 1: Enable the Metrics Endpoint in DockFlare
The first step is to tell DockFlare to enable the Prometheus metrics endpoint on its managed cloudflared agent.
You can do this by setting the CLOUDFLARED_METRICS_PORT environment variable for your DockFlare container.
Example docker-compose.yml:
services:
  dockflare:
    image: alplat/dockflare:stable
    # ... other settings
    environment:
      # Enable the metrics endpoint on port 2000 inside the container
      - CLOUDFLARED_METRICS_PORT=2000
When you restart DockFlare with this variable, it will automatically recreate its managed
cloudflared agent with the metrics server enabled on the specified port.
Note: This feature is only available in the default Internal Mode. If you are using External Mode, you are responsible for enabling the metrics endpoint on your own cloudflared agent.
Step 2: Set Up a Monitoring Stack
If you don't already have a monitoring stack, you can quickly set one up using Docker Compose. The DockFlare repository provides an example setup in the /examples directory.
For a complete, copy-paste guide on how to set up Prometheus and Grafana to monitor DockFlare, please refer to the grafana quick setup.md file in the repository.
This guide will walk you through:
1. Creating the necessary directory structure.
2. Adding Prometheus and Grafana services to your docker-compose.yml.
3. Configuring Prometheus to scrape metrics from the cloudflared agent.
4. Provisioning Grafana with the Prometheus data source automatically.
Step 3: Import the Pre-made Grafana Dashboard
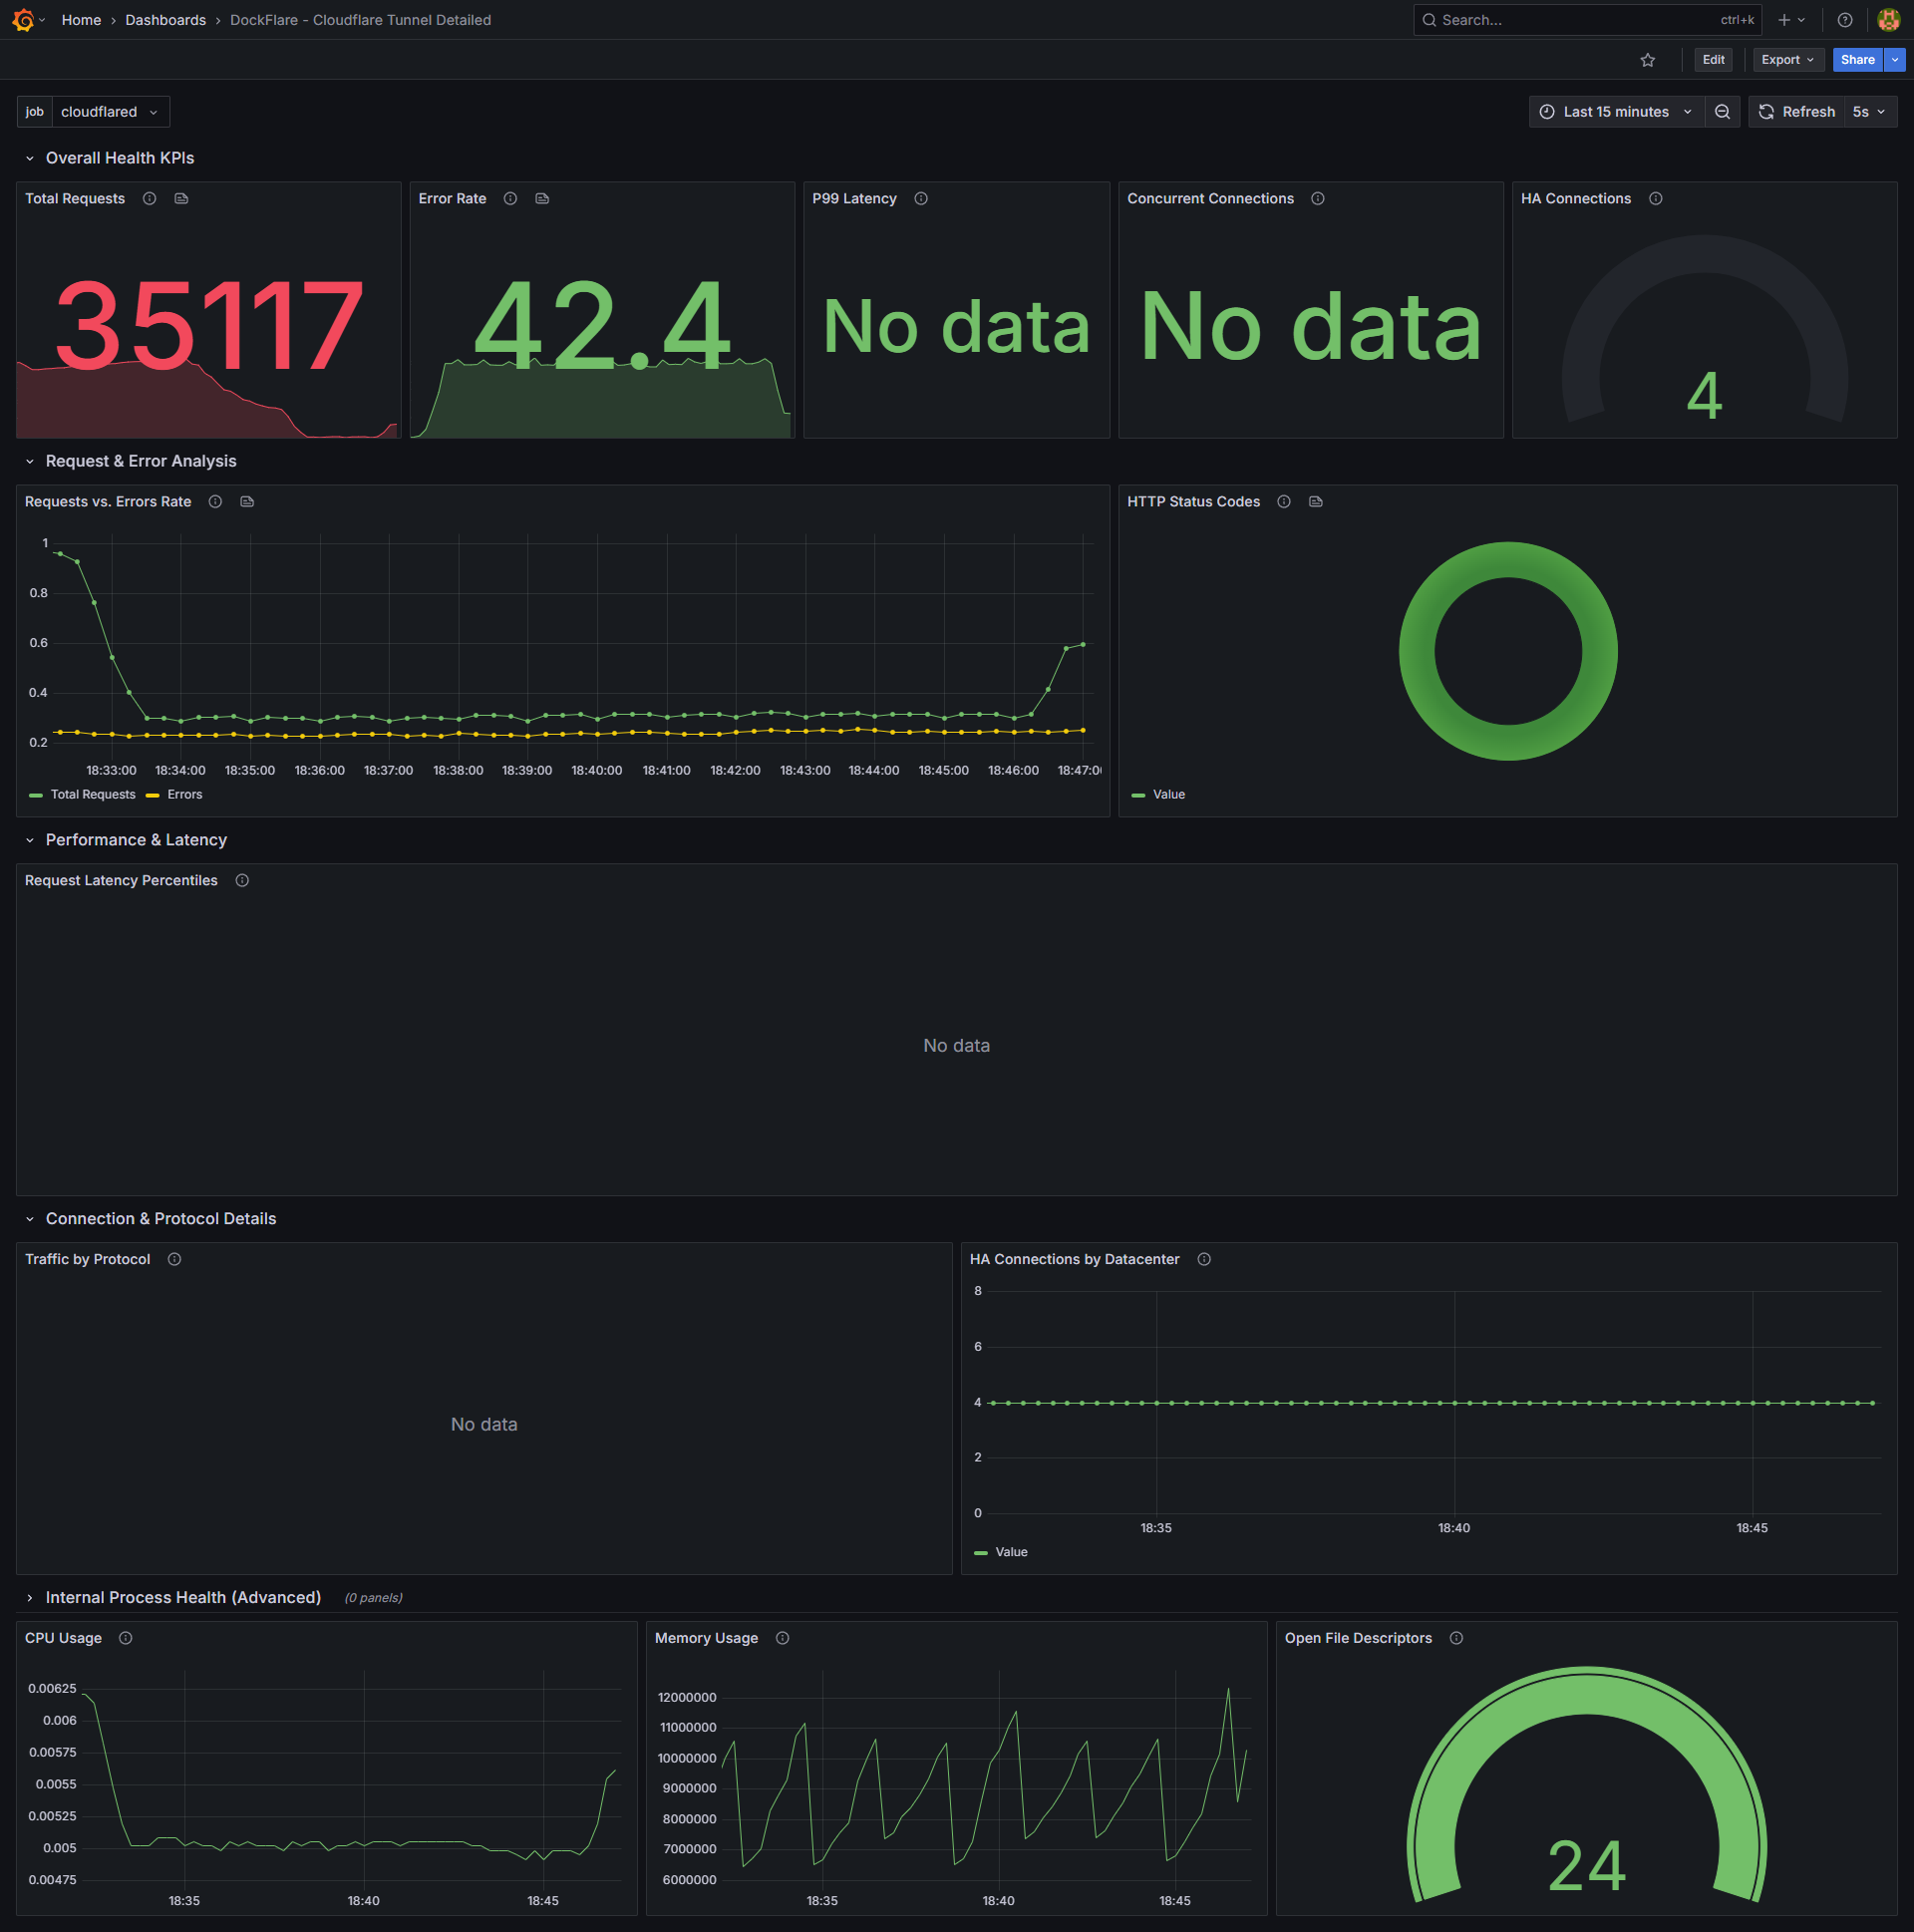
To make visualization easy, DockFlare provides a pre-made Grafana dashboard that is designed to work perfectly with the metrics exposed by the cloudflared agent.
- The dashboard is available as
dashboard.jsonin the/examplesdirectory of the repository. - Download this file.
- Log in to your Grafana instance.
- Go to the "Dashboards" section and click "Import".
- Upload the
dashboard.jsonfile. - Select your Prometheus data source and import the dashboard.
You will now have a complete overview of your Cloudflare Tunnel's performance, including request counts, error rates, connection latency, and more.